RSS
 

Posts Tagged ‘visualizations’

Virtual & Reality: 15 New York City Data Visualizations

31 Dec

[ By Steph in Design & Graphics & Branding. ]
NYC Infographics Main

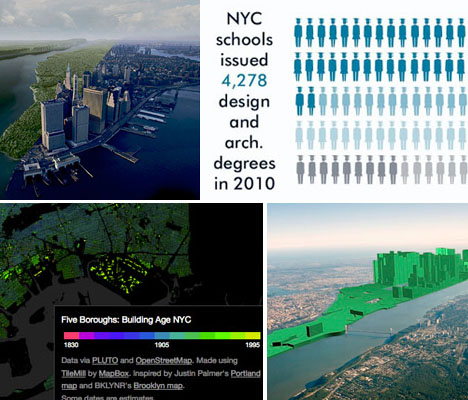
Data is much easier for most of us to process when it’s presented in visual form, and these 15 infographics and visualizations give us a (literal) picture of New York City that would be hard to come by otherwise. Exploring things like income inequality, building age, how the city has evolved and what its most popular hot spots are, these maps and charts illuminate the city in new ways.

Inequality and New York’s Subway
NYC Infographic Subway Inequality

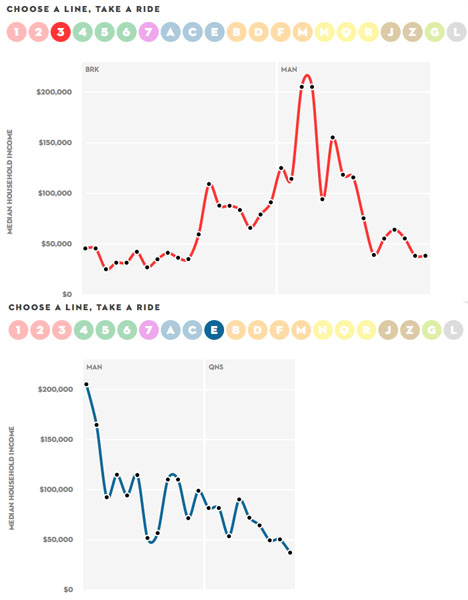
New York City’s inequality problem is even clearer when viewed by subway line, as this interactive infographic from The New Yorker illustrates. Using data on median household income from the U.S. Census Bureau, it allows you to see the areas where earnings range from abject poverty to sky-high wealth.

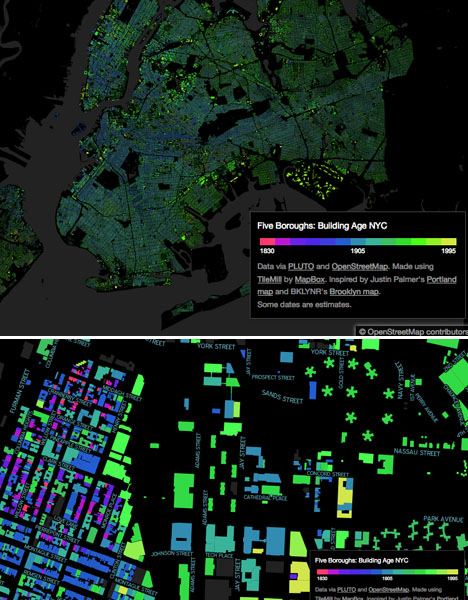
Building Age, NYC
NYC Infographics Building Age

Where are the city’s oldest buildings? You could read a list of them, but seeing them laid out visually on a map makes them easier to spot. See the ages of one million New York buildings mapped in vivid colors, zooming in and exploring by neighborhood, at BDON.org.

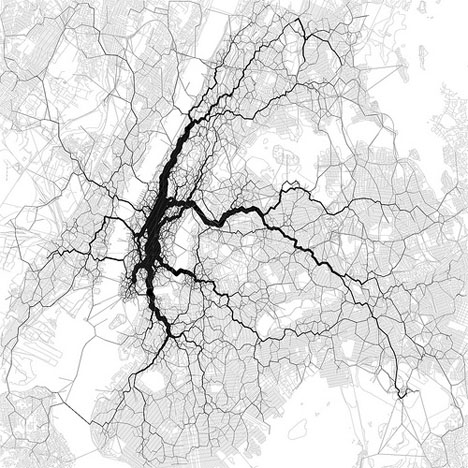
10,000 NYC-Based Tweet Locations
NYC Infographics Tweet Locations

Ten thousand New York City-based tweets are laid out on top of a map in this interesting data visualization. The creator, Eric Fischer, asks “Is this the structure of New York City?” Perhaps it’s really just bored people in subways and cabs taking a moment to tell the world what they ate for lunch.

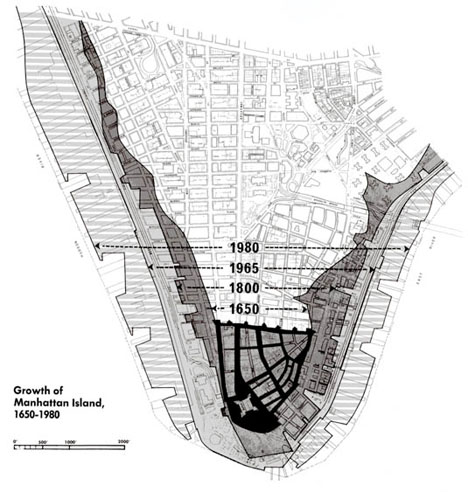
Growth of Manhattan Island, 1650-1980
NYC Infographic Growth of Manhattan

It’s easy to forget that  much of Manhattan Island (and the rest of New York City) used to be a marsh. The borders of the island were much further inland way back in 1650 when the first settlement was founded. By 1980, they had extended by a good 1,000 feet.

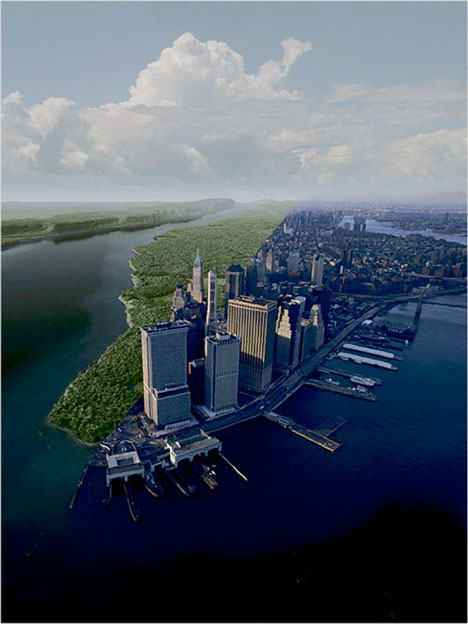
Manhattan Past, Present and Future
NYC Infographic Past Present

Here’s another visualization that shows the drastic changes in the island from the way it was when European settlers first arrived to how it looks today. The composite image shows the left side of the island as it was 400 years ago and the modern-day city on the right. How will it change in another 400 years?

Next Page – Click Below to Read More:
Virtual Reality 15 New York City Data Visualizations

Share on Facebook


[ By Steph in Design & Graphics & Branding. ]

[ WebUrbanist | Archives | Galleries | Privacy | TOS ]


WebUrbanist

 
Comments Off on Virtual & Reality: 15 New York City Data Visualizations

Posted in Creativity


City Evolution: Watch Urban Growth in 3D Visualizations

18 Jul

[ By Steph in Architecture & Cities & Urbanism. ]

City Growth Maps Main

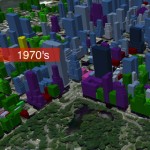
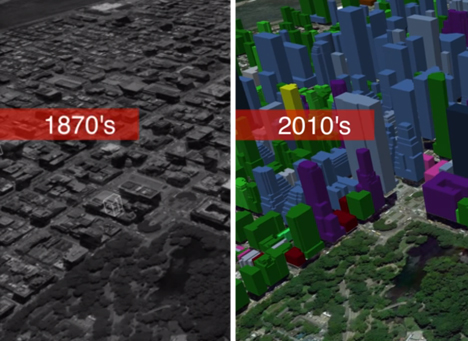
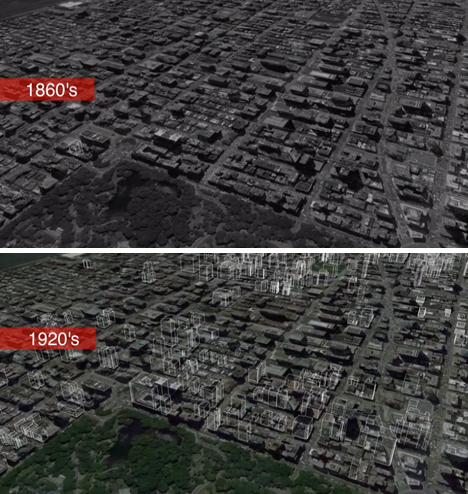
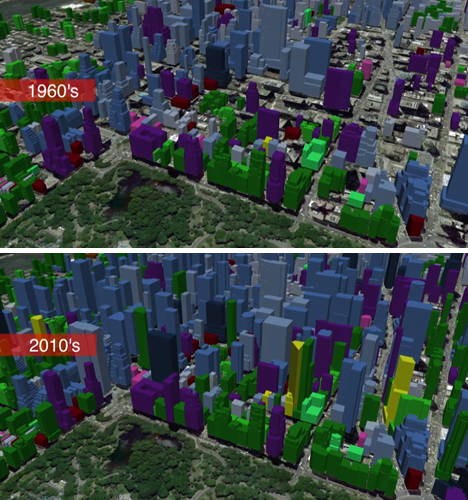
Watch Manhattan multiply and San Francisco soar into the sky in a series of growth animation videos that show the expansion of cities over more than a century. Created by Calgary-based real estate company Cube Cities, the videos utilize developer-reported data of building construction dates to show buildings pop upon top of city maps.

City Growth Maps NYC 1

City Growth Maps NYC 2

3D mapping technology from Google Earth provides the base of the videos, and animations show construction as it occurs through each decade. The videos highlight the busiest decades for growth, which is most visible in New York City during the 1920s, San Francisco during the ’60s and Toronto during the ’70s.

Next Page:
City Evolution Watch Urban Growth In 3d Visualizations

Share on Facebook


[ By Steph in Architecture & Cities & Urbanism. ]

[ WebUrbanist | Archives | Galleries | Privacy | TOS ]


WebUrbanist

 
Comments Off on City Evolution: Watch Urban Growth in 3D Visualizations

Posted in Creativity


Sound in Sand: Complex Visualizations of Audio Frequencies

07 Jun

[ By Steph in Art & Installation & Sound. ]

Sound in Sand 1
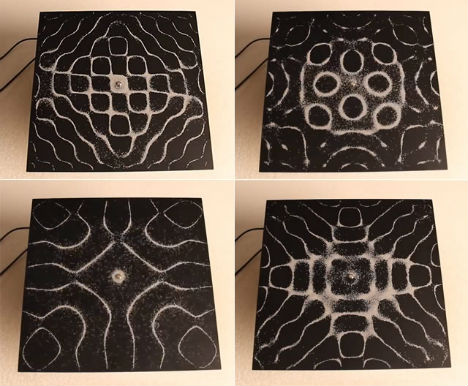
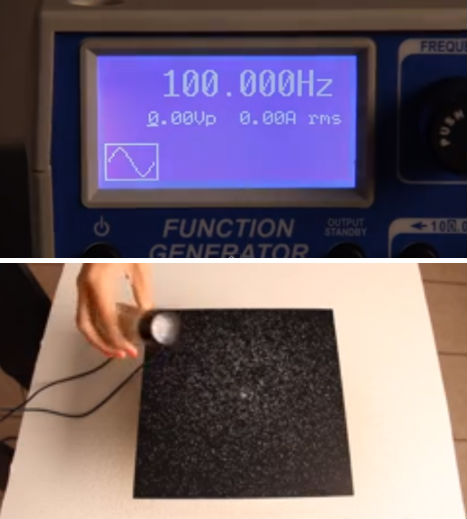
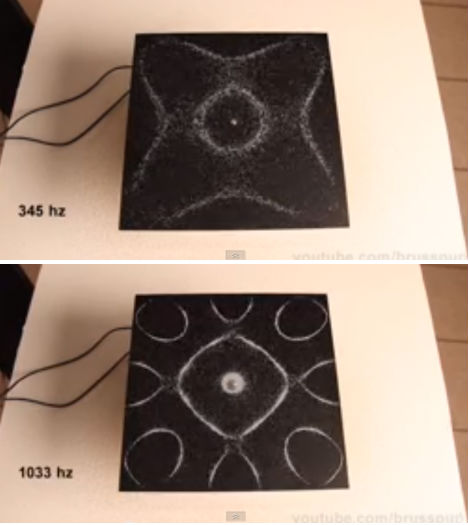
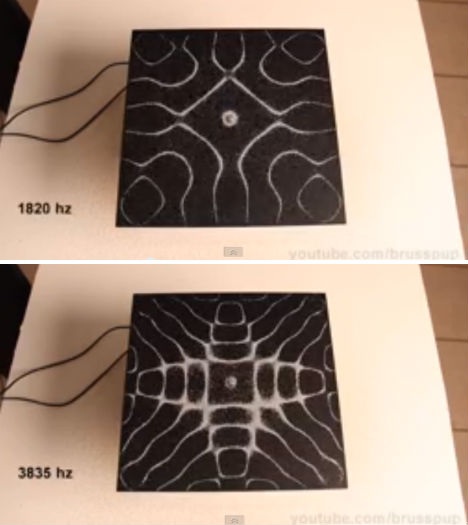
Grains of sand arrange themselves into complex geometric patterns according to audio frequencies in these fascinating resonance experiments by Youtube user Brusspup. The sand is sprinkled onto a black metal plate attached to a tone generator, which emits a series of increasing frequencies. The higher the frequencies, the more intricate the designs become.

Sound in Sand 2

This experiment is based on the Chiadni plate, invented by German physicist Ernst Chiadni in the 18th century. Chiadni used a violin bow along the edge of a glass plate covered with sand to create visualizations of sound. The plate is divided into regions vibrating in opposite directions, bounded by lines of zero vibration called nodal lines.

Sound in Sand 3

The plate was bowed until it reached resonance, at which point the vibration causes the sand to concentrate along the nodal lines where the surface is still. This technique is still used in the design and construction of acoustic instruments like violins and guitars.

Sound in Sand 4

Brusspup often experiments with the intersection of science and art. Previous projects have included running water through sound waves to produce incredible zig-zagging shapes, and a sound-based camera trick that makes water appear to travel backwards.

via This is Colossal

Share on Facebook


[ By Steph in Art & Installation & Sound. ]

[ WebUrbanist | Archives | Galleries | Privacy | TOS ]


WebUrbanist

 
Comments Off on Sound in Sand: Complex Visualizations of Audio Frequencies

Posted in Creativity


Transportation planner creates beautiful visualizations of flight patterns

30 May

Screen_Shot_2013-05-29_at_4.15.47_PM.png

Michael Markieta, a transportation planner at global engineering and design firm Arup, has created a series of beautiful visualizations of aircraft flight paths as they span the globe. Using different shades for short and long-distant flights, the images map the world in a ghostly spiderweb of connections from airports small and large. Markieta has marked more than 58,000 flightpaths and the results are stunning. Click through for images (via BBC.co.uk)

News: Digital Photography Review (dpreview.com)

 
Comments Off on Transportation planner creates beautiful visualizations of flight patterns

Posted in Uncategorized