RSS
 

Posts Tagged ‘Data’

Urban Jungle Street View: 3D Hack Uses Hidden Depth Data

26 Mar

[ By WebUrbanist in Gaming & Computing & Technology. ]

urban jungle street view

An explicitly illicit use of dimensional data buried in Google Street View, the Urban Jungle project adds eerie layers of post-apocalyptic green overgrowth to major cities around the world.

animated-new-york-city

urban jungle side street

As in Google Maps, a user can simply drag and drop their tiny avatar in a location of their choosing, then explore a plant-infested, tree-filled, vine-covered alternate version of reality. Click here to start exploring.

urban jungle street maps

From its creator: “This experiment using an undocumented part of Street View, the depth data. With that a depth map and a normal map is generated, which can be used in the shaders and to plot geometry and sprites in (almost) the correct position in 3d space.”

animated-street-jungle-view

street trees vines plants

Despite a glitch here or there, most locations and settings are shockingly convincing, looking like something that was lovingly crafted in incredible detail for a game (or an artist’s rendition of life after the apocalypse).

animated-time-square-signs

street view urban jungle

This otherworldly effect could just be the beginning – you too can grab the depth data at GitHub and create your own surreal landscapes or otherwise-hacked environments (samples via GMM, PSFK & PK).

Share on Facebook


[ By WebUrbanist in Gaming & Computing & Technology. ]

[ WebUrbanist | Archives | Galleries | Privacy | TOS ]


WebUrbanist

 
Comments Off on Urban Jungle Street View: 3D Hack Uses Hidden Depth Data

Posted in Creativity


7 Years of Data: How Social Media Has Impacted JMG-Galleries Web Traffic

01 Jan

At the close of every year I like to take a look at the web metric trends on my web site via Google Analytics and forecast how I might need to adapt over the coming year(s). Yesterday I reviewed the trends of mobile web traffic and today I’ll dive into the larger trends of referring traffic from social media web sites. If you’re familiar with my past writing on social media trends and strategies you’ll know I’ve always been a big proponent of social media and it’s potential to help photographers. In the time I’ve been writing on social media and it’s benefits there has always been the lingering question, “What is the real impact of taking part in Social Media?”. That’s a multi-dimensional question that can be answered in relation to revenue, web traffic, brand awareness, time, mental health, etc. For the sake of simplicity let’s take a look at referring web traffic to my web site JMG-Galleries over the course of 7 years and across 9 social media sites.

First I learned a few things that were not so obvious in the process of evaluating the referring traffic from social media web sites:

  1. Trends were equally determined by my use of a particular site, as it was about the popularity of that site. (i.e. A site is only as good as you make use of it, no matter how popular/unpopular it may be.)
  2. Social media sites have a life span and are subject to fluctuations in popularity that may impact traffic to your site.
  3. The most talked about social media sites (those with great PR) are not always the best performers.
  4. Honing in on a social media site with the right audience (even if smaller) that is active can often be more important than focusing on a sites total audience size.


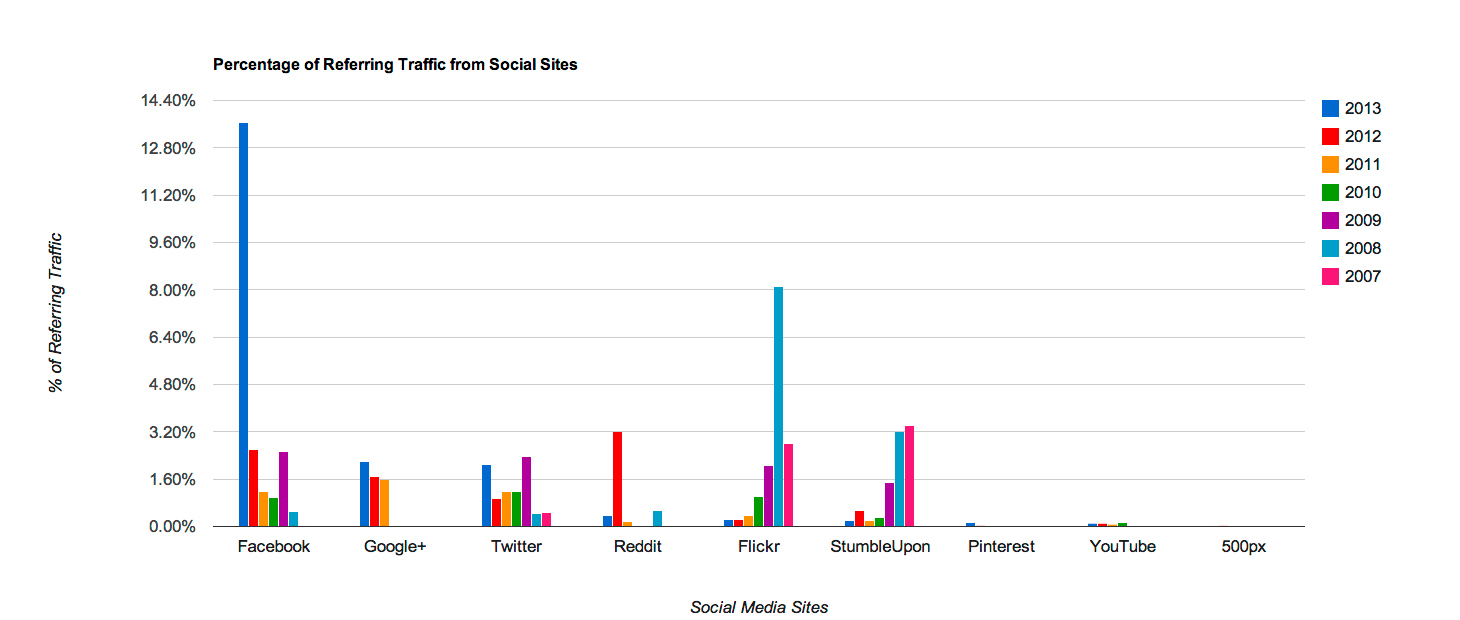
All Social Media Sites Compared

Percentage of Referring Traffic from 9 Social Media Web Sites

The first thing you’ll likely notice is that the big standouts are Facebook and Flickr, but take note of the year difference (2013 vs 2008). What fascinated me when taking in this data the first time was the rise and decline of certain social media web sites. Part of the fluctuation was a reflection a web sites overall trending popularity by its users and on the flip side my personal increase/lack of interest in a site.  The other telling thing about this graph is being able to size up the potential impact of competitor sites (ex. Flickr vs 500px). There’s a lot more to this graph when you dive into each site so let’s get a little more granular…

“Content is King” Sites

Reddit over the lifespan of my web site has always been the source of unexpected and pleasant surprises generating healthy bumps in traffic. I’ve never seeded an article there and only created an account there a few months ago. The community there can be brutal on people that pimp themselves so I advise against trying it. What ultimately caught the eye of Reddit users and generated traffic to my site was informative and thought provoking content. The same is true of  YouTube even though I’ve never been a big video creator. What’s cool about YouTube is that it is essentially the 2nd largest search engine (if you lump it in to the search category), so if you create good content there it’s highly likely it will eventually be found. If it’s the right content you might see a delayed impact to referring traffic. Case in point is a review I did of a Canon 800mm f/5.6 lens from BorrowLenses.com.  The first 2 months it fell flat but it’s since picked up interest garnering nearly 200K views.

Flickr vs 500px

Referring Traffic from Flickr to JMG-Galleries.com

First and foremost I’m not taking a stand on which site is better. While both Flickr and 500px are photo sharing sites I’ve used them differently. I used to plug my web site a lot in image descriptions on Flickr particularly when I was running my podcast EXIF and Beyond. While I still plug my web site in image descriptions on 500px I’ve cut down on my photo sharing on 500px and Flickr. This has been mostly a reflection of my dwindling free time since having my son.

Referring Traffic from 500px to JMG-Galleries.com

To date I have 63 images on my 500px account and on my Flickr account I have 1038 photos. Given that Flickr performs very well as an image search engine I still receive decent referral traffic from the site even though I’m not very active there. We’ll see how 500px performs over time. One dimension of these two sites that I can’t escape mentioning is that even though Flickr has it’s flaws it still has a robust audience. I nearly wrote it off, but after posting a few photos there this year I’ll continue posting photos there. Both Flickr and 500px have ways of highlighting photos to their larger audience through Explore (Flickr) and Pulse (500px) which can boost traffic to your site. Having your images surface in these algorithm driven highlight systems can be hit or miss and an easy sink hole to get sucked into if you’re big on gaming systems. That said systems that can be gamed are always being changed as was the case with 500px’s Pulse in November.

Hyped Sites Then & Now – StumbleUpon vs Pinterest

Referring Traffic Trends from Pinterest

Pinterest took the photography community by storm, albeit more so because of copyright concerns. That never scared me off, but what did was its poor performance. While other photographers hailed it as the biggest thing since sliced bread I’ve never seen it generate great referral traffic. My Pinterest account is still active,  I’ll pin my blog posts and announcements there from time to time and I’ll monitor what of my work is being pinned. Other than that I’ve backed off aggressively courting Pinterest users/traffic. One caveat that I will add to this is that Pinterest has the potential to be great for certain types of photography/photographers. The demographic is heavily weighted toward young females, a perfect target audience for wedding photographers.

Referring Traffic Trends from StumbleUpon

StumbleUpon on the other hand not only received hype it actually performed. I never was an active Stumbler, but my site benefited from the activity of Stumblers that followed my blog. One thing that is obvious from the chart above is that the activity of people coming from StumbleUpon has dropped sharply. My educated guess here is that StumbleUpon has been supplanted by Facebook and/or StumbleUpon users that followed my blog have dropped off for one reason or another. My money is on the Facebook effect.

 The Giants – Facebook vs Google+

Referring Traffic from Google+ to JMG-Galleries.com

Like many photographers I have a love-hate relationship with Google+ and Facebook. Google+ is very photographer friendly, but it’s a bit all over the place with a semi-scattered feature set (communities, pages, auto-this&that, Picassa integration, circles, etc.)  Facebook is the king of social activity, but has shot itself in the foot repeatedly with photographers regarding their terms of use and privacy policies. Google+ is interesting because I have a very large following there, but over time I’ve tried to minimize self-promotion unless something special is happening like an eBook discount, giveaway or blog project. Due to my busy schedule the past year, I have not been posting my photos with the same frequency as when I first started my account. Still my referral traffic is on the rise even with fewer photos shared, but I attribute this to being a bit more focused on my self-promotion amid sharing interesting content from other sources and even other photographers.

Referring Traffic from Facebook to JMG-Galleries.com

I was quick to create a personal Facebook page when Facebook opened its doors to non-college students (2006), but slow to launch a business page (2010). I was never super active on my personal page, but active enough it would seem. What helped in the early days was connecting my blog to my Facebook page so that new blog posts would display in my timeline automatically. Now I’m less fond of the automatic updates and am leaning toward killing this in 2014. One thing that Facebook deserves a lot of credit for is creating a feature rich business page that has an “easy” time making its way into my fans’s timeline. Google+ could learn a lesson or two on that front.  I don’t post a lot on my business page and share photos conservatively. This shows in the lower numbers in the chart above (2011/2010), but the jump in 2013 can be attributed to my sharing photos on my fan page and in groups where some of my updates have gone viral. I also have been experimenting with promoted posts, but those have been directing people to another domain and should have no impact to these numbers. One thing about Facebook that has me on edge is how their timeline algorithm has recently changed and Facebook’s increasing slant toward paid promotion. A publicly traded company has to create earnings, but I don’t have to like it nor take part. We’ll see how things play out.

Twitter

Percentage of Referring Traffic from Twitter to JMG-Galleries.com

I still love Twitter, but that’s because it compliments my incessant reading and news junkie tendencies. I was rather surprised that the referral traffic wasn’t higher for Twitter, but it’s still decent. 2013 and 2009 were good years for traffic, but I don’t recall doing anything drastically different. I thought posting frequency might be behind the higher referral traffic numbers, but I’ve posted less in 2013 than in years prior and I likely was posting a lot in 2009.  Seeing the stark differences in posting behavior I doubt frequency has anything to do with it. Twitter to me also falls under the category of “Content is King” especially if you’re a content creator.  If anything I’m guessing great content begets referral traffic especially if your great content is being retweeted and shared.

Concluding Thoughts

As it relates to referring traffic I have no regrets in taking part in Social Media and my prior enthusiasm for it still holds. I think it is still a worthy use of time, resources and money.  I’m still digesting this data so I will certainly be taking it into consideration as I plan out and ramp up my social media activity in 2014.

Copyright Jim M. Goldstein, All Rights Reserved

7 Years of Data: How Social Media Has Impacted JMG-Galleries Web Traffic

The post 7 Years of Data: How Social Media Has Impacted JMG-Galleries Web Traffic appeared first on JMG-Galleries – Landscape, Nature & Travel Photography.


Related Stories

  • 7 Years of Data: How Social Media Has Impacted JMG-Galleries Web Traffic – Enclosure
  • Recommended Reading: Make Use Of Instagram
  • Recommended Reading: Make Use Of Instagram – Enclosure
Feed Ads by FeedBlitz
powered by ad choices


JMG-Galleries

 
Comments Off on 7 Years of Data: How Social Media Has Impacted JMG-Galleries Web Traffic

Posted in Equipment


Virtual & Reality: 15 New York City Data Visualizations

31 Dec

[ By Steph in Design & Graphics & Branding. ]

NYC Infographics Main

Data is much easier for most of us to process when it’s presented in visual form, and these 15 infographics and visualizations give us a (literal) picture of New York City that would be hard to come by otherwise. Exploring things like income inequality, building age, how the city has evolved and what its most popular hot spots are, these maps and charts illuminate the city in new ways.

Inequality and New York’s Subway

NYC Infographic Subway Inequality

New York City’s inequality problem is even clearer when viewed by subway line, as this interactive infographic from The New Yorker illustrates. Using data on median household income from the U.S. Census Bureau, it allows you to see the areas where earnings range from abject poverty to sky-high wealth.

Building Age, NYC

NYC Infographics Building Age

Where are the city’s oldest buildings? You could read a list of them, but seeing them laid out visually on a map makes them easier to spot. See the ages of one million New York buildings mapped in vivid colors, zooming in and exploring by neighborhood, at BDON.org.

10,000 NYC-Based Tweet Locations

NYC Infographics Tweet Locations

Ten thousand New York City-based tweets are laid out on top of a map in this interesting data visualization. The creator, Eric Fischer, asks “Is this the structure of New York City?” Perhaps it’s really just bored people in subways and cabs taking a moment to tell the world what they ate for lunch.

Growth of Manhattan Island, 1650-1980

NYC Infographic Growth of Manhattan

It’s easy to forget that  much of Manhattan Island (and the rest of New York City) used to be a marsh. The borders of the island were much further inland way back in 1650 when the first settlement was founded. By 1980, they had extended by a good 1,000 feet.

Manhattan Past, Present and Future

NYC Infographic Past Present

Here’s another visualization that shows the drastic changes in the island from the way it was when European settlers first arrived to how it looks today. The composite image shows the left side of the island as it was 400 years ago and the modern-day city on the right. How will it change in another 400 years?

Next Page – Click Below to Read More:
Virtual Reality 15 New York City Data Visualizations

Share on Facebook


[ By Steph in Design & Graphics & Branding. ]

[ WebUrbanist | Archives | Galleries | Privacy | TOS ]


WebUrbanist

 
Comments Off on Virtual & Reality: 15 New York City Data Visualizations

Posted in Creativity


Lens reviews update: test data for the Sigma 24-105mm f/4 DG OS HSM

16 Dec

lensreview-thingsmall1.png

DxOMark has just reviewed the Sigma 24-105mm f/4 DG OS HSM, a general-purpose zoom for full frame SLRs. As part of our ongoing collaboration we’ve added the test data to our lens widget, and looked to see how it compares to the Canon equivalent. We’ve also added test data for the Nikon mount version of Zeiss’s stellar Apo Sonnar T* 2/135. Click through for our full analysis, and a link to DxOMark’s own reviews.

News: Digital Photography Review (dpreview.com)

 
Comments Off on Lens reviews update: test data for the Sigma 24-105mm f/4 DG OS HSM

Posted in Uncategorized


Lens reviews update: test data for the Zeiss Otus 1.4/55

22 Nov

lensreview-thingsmall1.png

DxOMark has just reviewed the Zeiss Otus 1.4/55, a $ 4000 standard prime for full frame SLRs, and as part of our ongoing collaboration we’ve added the test data to our lens widget. We’ve also added test data for the Nikon mount version of Sigma’s exception 18-35mm F1.8 DC HSM. Click through for more details and analysis, including a comparison between the Zeiss 55mm and the Nikon 58mm f/1.4G, and a link to DxOMark’s own review.

News: Digital Photography Review (dpreview.com)

 
Comments Off on Lens reviews update: test data for the Zeiss Otus 1.4/55

Posted in Uncategorized


Lens reviews update: test data for the Nikon 58mm f/1.4G

13 Nov

lensreview-thingsmall1.png

DxOMark has recently reviewed Nikon’s AF-S Nikkor 58mm f/1.4G, a high-end (and very expensive) standard prime for full frame SLRs. As a taster for our upcoming review we’ve added the test data to our lens widget; as usual you can compare it to similar lenses, including the Nikon and Sigma 50mm F1.4s. Click through for more details and analysis, and a link to DxOMark’s own review of the Nikon 58mm F1.4.

News: Digital Photography Review (dpreview.com)

 
Comments Off on Lens reviews update: test data for the Nikon 58mm f/1.4G

Posted in Uncategorized


Adobe accounts hacked, data exposed for 2.9 million customers

04 Oct

Adobe-Creative-Cloud-Logo.jpeg

Cyber attackers breached Adobe’s security recently, compromising data on 2.9 million customers. Data accessed includes ‘customer names, encrypted credit or debit card numbers, expiration dates, and other information relating to customer orders,’ according to a company blog post. The attack exposes a weakness in the company’s new Creative Cloud subscription model, which omits the ‘bits-in-a-box’ distribution method in favor of faster access to software downloads through a monthly subscription. Click through for more. 

News: Digital Photography Review (dpreview.com)

 
Comments Off on Adobe accounts hacked, data exposed for 2.9 million customers

Posted in Uncategorized


Nikon updates distortion correction data for DSLRs, adding latest lenses

20 Jul

AFS_Nikkor_18_35_ED.png

Nikon has released distortion correction data v1.009, adding support for additional lenses for the D4, D90, D600, D800, D800E, D3100, D3200, D5000, D5100, D5200, D7000 and D7100. The latest update means these cameras can now correct distortion in 107 Nikkor lenses. The latest update includes recent launches such as the Nikon AF-S Nikkor 18-35mm f/3.5-4.5G ED and can be downloaded from Nikon’s global website.

News: Digital Photography Review (dpreview.com)

 
Comments Off on Nikon updates distortion correction data for DSLRs, adding latest lenses

Posted in Uncategorized


Sigma 18-35mm F1.8 DC HSM preview updated with lens test data

16 Jul

18-35-news.png

We’ve just updated our preview of the Sigma 18-35mm F1.8 DC HSM with lens test data, courtesy of DxOMark. This lens has generated a lot of excitement as the fastest zoom ever made for SLRs, but the big question is whether its speed comes at the cost of optical quality. We’ve looked into this by comparing the 18-35mm to some current benchmark designs – and the results may surprise you. Click through to read all about it.

News: Digital Photography Review (dpreview.com)

 
Comments Off on Sigma 18-35mm F1.8 DC HSM preview updated with lens test data

Posted in Uncategorized


Lens reviews update: DxOMark data for Sony NEX primes

05 Jul

lensreview-thingsmall1.png

DxOMark has been busy testing lenses for the Sony NEX system, and has just published an article detailing which lenses score best on the NEX-7. As part of our ongoing collaboration, we’ve added the test data for most of Sony’s own E-mount primes to our lens widget, which you can use to assess their performance and compare them against each other. We’ll be adding Sony’s zoom lenses and third-party primes very soon, but for now you can explore the test data for the Carl Zeiss Sonnar T* E 24mm F1.8 ZA, E 20mm F2.8, E 30mm F3.5 Macro, E 35mm F1.8 OSS and E 50mm F1.8 OSS. Click through for the links. 

News: Digital Photography Review (dpreview.com)

 
Comments Off on Lens reviews update: DxOMark data for Sony NEX primes

Posted in Uncategorized