[ By Steph in Architecture & Cities & Urbanism. ]
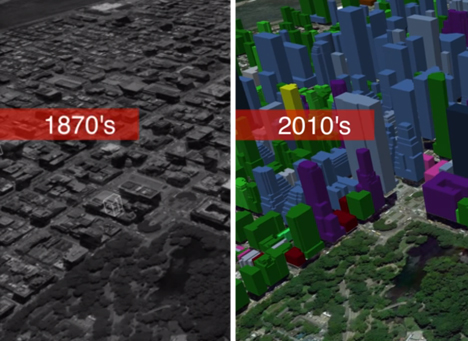
Watch Manhattan multiply and San Francisco soar into the sky in a series of growth animation videos that show the expansion of cities over more than a century. Created by Calgary-based real estate company Cube Cities, the videos utilize developer-reported data of building construction dates to show buildings pop upon top of city maps.
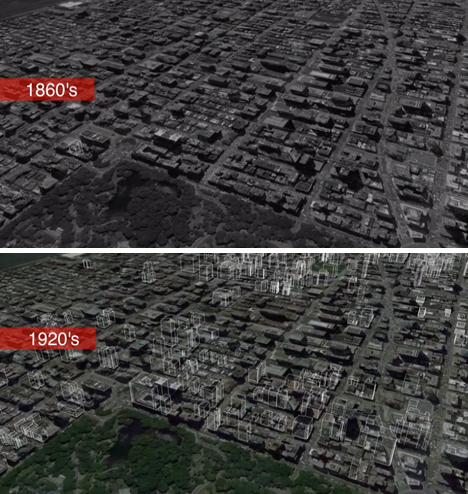
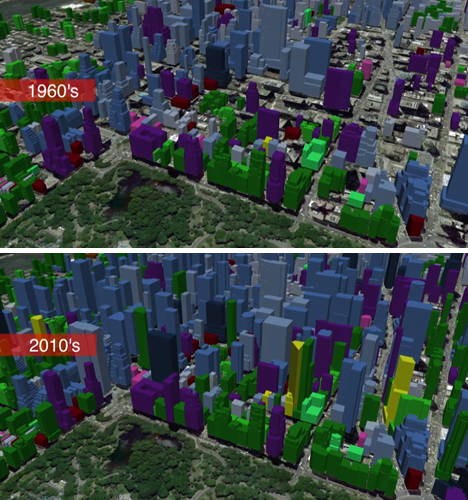
3D mapping technology from Google Earth provides the base of the videos, and animations show construction as it occurs through each decade. The videos highlight the busiest decades for growth, which is most visible in New York City during the 1920s, San Francisco during the ’60s and Toronto during the ’70s.
Next Page:
City Evolution Watch Urban Growth In 3d Visualizations
![]()


[ By Steph in Architecture & Cities & Urbanism. ]
[ WebUrbanist | Archives | Galleries | Privacy | TOS ]
![]()
     |