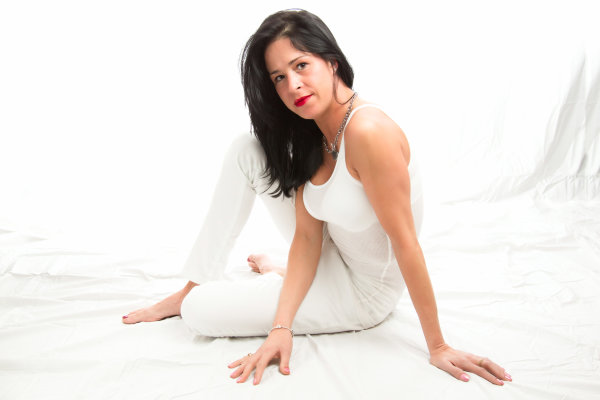
The finished image was a nice, high key portrait. See below for details on the histogram.
To many newbie photographers, getting the proper exposure in camera is the biggest challenge they face. While letting the camera do the work for them turns out fine most of the time, there are many times where the camera can require some help. Knowing just how to give your camera that help is key to getting an image you’ll want to keep. The best way to judge an exposure (or a potential exposure, when using Live View) is to use your camera’s histogram.
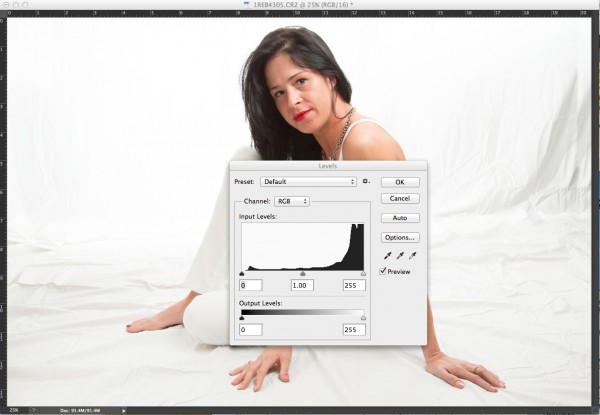
In this high key portrait, the histogram shows a majority of pixels on the right side, representing brighter pixels. This is to be expected due to the white background and outfit worn. The pixels in the middle of the histogram represent the subject’s skin tones, while the small dark peak on the left represents her hair. Notice also, that this histogram does show some highlight clipping. In some images, this may be a problem, but since this is a high key portrait and the background is the bright white area, and the skin tones are good, this is not a problem for this image.
A histogram, in it’s simplest terms, is simply a graph showing the brightness levels of pixels in the image. The right side of the graph represents bright pixels, while darker pixels are shown on the left side. Pixels representing midtones are in the middle, of course. A histogram runs, from left to right, showing values from 0- black, to 255- white. The height of the histogram represents how many pixels are recorded at a given brightness level. The primary aspects of the histogram that one should be concerned with are the left and right edges. Any pixels that recorded as bright white (255) or as pure black (0), would be pushed up against the edge of the graph.
Since a histogram is simply a representation of the tonal range of a given image, there really is no right or wrong histogram. The histogram will change based on the tones in an image. A high-key portrait, for example, would show pixels mainly to the right side of the histogram. A low-key image would show pixels mainly to the left side of the histogram. An image with a wide tonal range would show pixels across the entire histogram.
As I mentioned, when judging exposure, the primary areas of the histogram to be concerned with are the right and left edges. Pixels in these areas are rendering as bright white, or dark black. Generally speaking, unless an image is intended to show bright white or pure black areas, pixels pushed up to the very edge of the histogram could indicate an exposure problem. This is also known as “clipping”. For instance, when a large number of pixels are pushed against the right side of the histogram, in essence, being cut off by the edge of the histogram, it is said that the highlights are clipped.
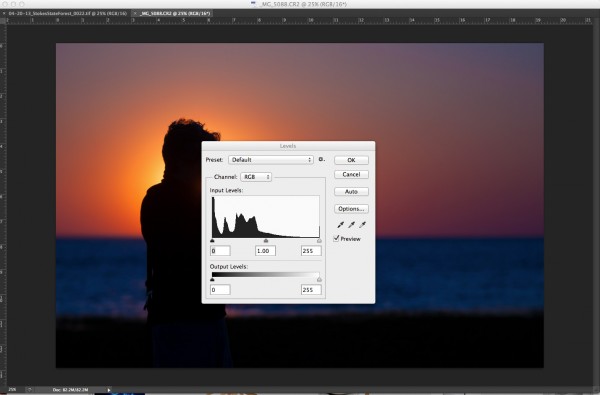
In this image, since the subject is in silhouette, and there are lots of dark tones, we expect to see most pixels on the left side of the histogram.
When judging the histogram, one must take into account the subject matter of the image. If the image should show bright white areas, yet the histogram shows the pixels as rendering more middle grey, due to the way the camera’s meter sets the exposure, you can then use exposure compensation or adjust your exposure manually to increase exposure and achieve the desired result. The same is true for darker images that the camera overexposes because the meter is trying to achieve middle grey. By reducing exposure, either manually by changing your shutter speed, aperture, or ISO, or by using exposure compensation, you can darken the image to achieve the desired image. The histogram of this new image will reflect the change to exposure.
Now, here’s the big secret. If you use Live View on your camera, you can view a live histogram, that will update and reflect changes in exposure when your exposure changes. This means you can judge what your current exposure is, and watch in real time how changes to that exposure will affect your image. It’s a great way to get a feel for how even a slight adjustment in shutter speed, aperture, or ISO can affect your exposure.
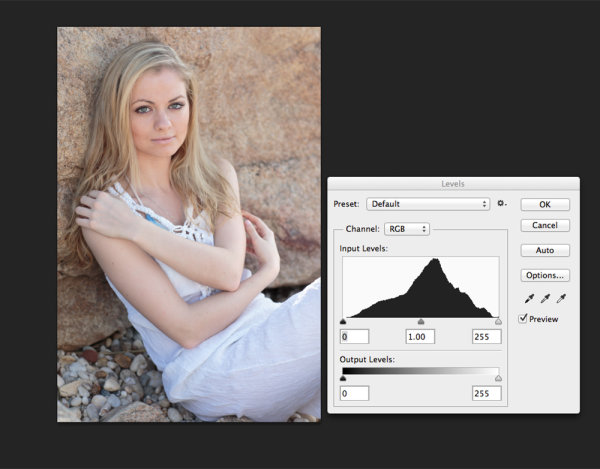
This portrait shows more midtones than anything else, so we see more of a classic peak near the center of the histogram, with the pixels falling off as they get to the edges of the histogram. You can see that neither the highlights or shadows are clipped .
Post originally from: Digital Photography Tips.
Check out our more Photography Tips at Photography Tips for Beginners, Portrait Photography Tips and Wedding Photography Tips.
Histograms: Your Guide To Proper Exposure
You must be logged in to post a comment.